In the figure, $\text{ln }(\rho _i)$ is plotted as a function of $1/T$, where $\rho_i$ is the intrinsic resistivity of silicon, $T$ is the temperature, and the plot is almost linear.
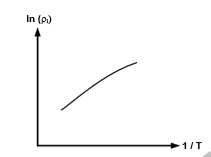
The slope of the line can be used to estimate
- band gap energy of silicon $(E_g)$
- sum of electron and hole mobility in silicon $(\mu _n + \mu _p)$
- reciprocal of the sum of electron and hole mobility in silicon $(\mu _n + \mu _p)^{-1}$
- intrinsic carrier concentration of silicon $(n_i)$