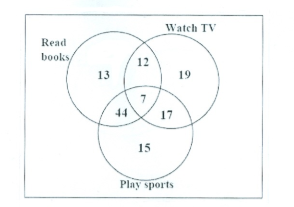
0 votes 0 votes The Venn diagram shows the preference of the students population for leisure activities. From the data given, the number of students who like to read books or play sports is _____. $44$ $51$ $79$ $108$ Quantitative Aptitude gate2016-ec-2 numerical-ability venn-diagrams + – Milicevic3306 asked Mar 27, 2018 • recategorized Mar 1, 2021 by Lakshman Bhaiya Milicevic3306 16.0k points 98 views answer comment Share Follow See all 0 reply Please log in or register to add a comment.