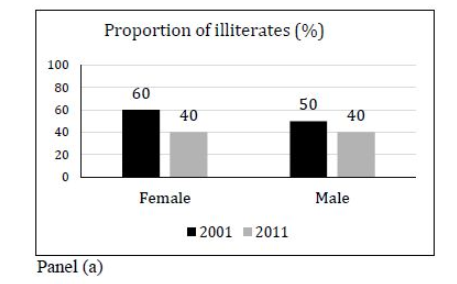
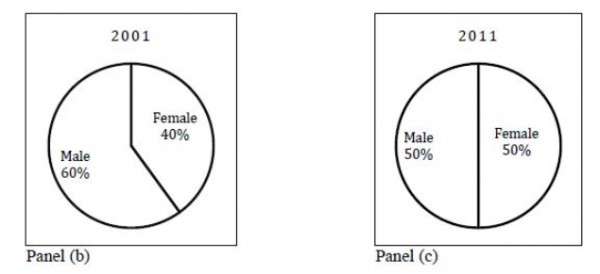
The bar graph in panel (a) shows the proportion of male and female illiterates in $2001$ and $2011.$ The proportions of males and females in $2001$ and $2011$ are given in Panel (b) and (c), respectively. The total population did not change during this period. The percentage increase in the total number of literates from $2001$ to $2011$ is ______.
- $30.43$
- $33.43$
- $34.43$
- $35.43$