The bar chart shows the data for the percentage of population falling into different categories based on Body Mass Index $\text{(BMI)}$ in $2003$ and $2023$.
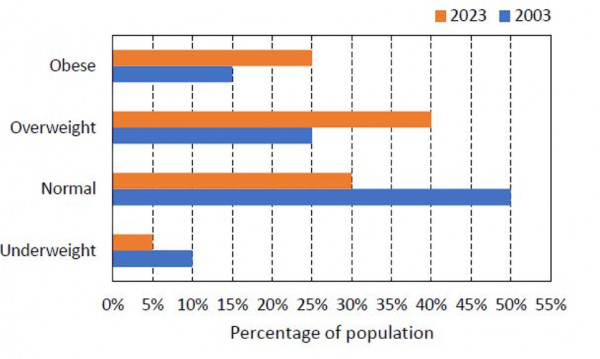
Based on the data provided, which one of the following options is INCORRECT?
- The ratio of the percentage of population falling into overweight category to the percentage of population falling into normal category has increased in $20$ years.
- The ratio of the percentage of population falling into underweight category to the percentage of population falling into normal category has decreased in $20$ years.
- The ratio of the percentage of population falling into obese category to the percentage of population falling into normal category has decreased in $20$ years.
- The percentage of population falling into normal category has decreased in $20$ years.