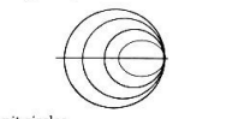
0 votes 0 votes Many circles are drawn in a Smith chart used for transmission line calculations. The circles shown in the figure represent unit circles. constant resistance circles. constant reactance circles. constant reflection coefficient circles. Others gate2005-ec + – admin asked Sep 22, 2022 • edited Nov 30, 2023 by makhdoom ghaya admin 46.4k points 107 views answer comment Share Follow See all 0 reply Please log in or register to add a comment.